How to take lecture notes that stick (free revision template)
- Copying every sentence splits your attention, and transcribing isn't understanding.
- Let the notes take care of themselves. TalkGraph maps the lecture live and keeps the transcript, so you can think about each point instead of writing it down.
- The learning happens after: question yourself and explain it out loud. TalkGraph asks you questions and brings ideas back for practice. Free template below.
Good lecture notes free you to think. Racing to copy every sentence splits your attention and isn't the same as understanding. When the note-taking is done for you, you can actually engage with what the lecturer is saying: question it, connect it, decide whether you agree. TalkGraph maps the lecture as it happens, so your effort goes into thinking about the points, then explaining them back afterwards.
Most students take lecture notes as if the goal were a perfect copy. You write as fast as you can, miss half of what's said while writing the other half, and end up with pages that feel thorough and are almost impossible to revise from.
Notes are only worth having if they make the next step, actually learning the material, easier. That changes what to aim for.
Why copying the lecture doesn't help you learn
When you try to write everything down, you're processing words, not ideas. A well-known 2014 study by Pam Mueller and Daniel Oppenheimer found that students who copied lectures word for word did worse on conceptual questions than students who had to summarise in their own words. (A larger replication in 2019 found the gap smaller and less consistent, but the direction of the advice holds.) The problem was never the screen. It's spending your effort on copying instead of on working with the ideas.
What does help is seeing how ideas connect, and putting them in your own words. Concept mapping, laying out ideas and the links between them, is one of the better-evidenced study methods: a meta-analysis of 55 studies covering 5,818 learners found it improves both retention and the ability to apply what you've learned. Those studies used maps students drew themselves; drawing them by hand is slow, which is why few people do it mid-lecture.
That's the gap TalkGraph is built for. It maps the lecture into a visual structure of topics and ideas as it happens, so you can see the shape of the subject, and it lets you map your own explanation in your own words afterwards. Copying is replaced by structure, and by your understanding.
Before the lecture
Ten minutes is enough. Skim the slides or reading if they're available, and write down two or three questions you expect the lecture to answer. You'll listen for answers rather than trying to record everything that goes past.
During the lecture: listen, and capture the structure
What to capture
Lectures have a shape: a few main ideas, each with explanation and examples. That shape is what you need. Definitions and formulas are worth having exactly. Anything that lost you is worth marking, so you know what to come back to.
Doing it by hand
Main ideas as headings, key points beneath, an example where it helps, a "?" next to anything you didn't follow. It works, but it's hard to do well while also listening, which is why most notes end up either too thin or too long.
Letting TalkGraph capture it
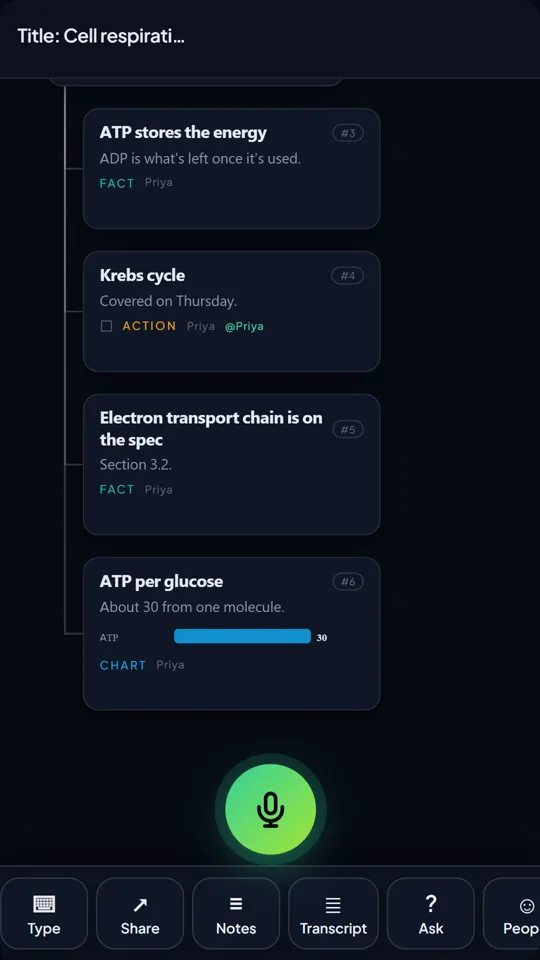
TalkGraph listens to the lecture, from your microphone in the room or, for an online or recorded lecture, from your browser tab on desktop Chrome and Edge, and builds the structure as the lecturer speaks: topics as branches, facts and definitions as cards beneath, questions marked as question cards. The full transcript is kept too, so nothing is lost if you want the exact wording later. Your job is to listen. Check your institution's recording policy first.
Now actually think about the lecture
This is what changes when the note-taking is done for you. Instead of worrying about keeping up, you can engage with each point the lecturer makes. A few ways to use that attention:
- Ask yourself whether you agree, and why. Disagreeing with a point is one of the fastest ways to understand it.
- Connect it to last week. Where does this idea fit with what you already know?
- Predict the next step. Before the lecturer gets there, guess where the argument is going.
- Notice what confuses you, and stay with it, rather than scribbling it down and moving on.
- Ask the question in the room. You have the bandwidth now.
You're no longer a transcriber. You're the person in the room thinking about what's being said, which is the whole point of being there.
Four note-taking methods, and where TalkGraph fits
- Cornell. A cue column for questions, notes on the right, a summary at the bottom. Built for testing yourself afterwards. TalkGraph's question cards play the role of the cue column.
- Mapping. The topic in the centre, branches for each idea. Good for subjects where connections matter. A TalkGraph map is this method, built for you as the lecture happens.
- Outline. Headings and indented points. Fast for well-structured lectures, and close to how a TalkGraph map reads when you collapse its branches.
- Charting. Columns for comparing several things on the same features. Spoken numbers in TalkGraph become chart cards.
After the lecture: where the learning happens
Whatever captured the lecture, this is the part that does the work, and the part most students skip.
Take notes on your own understanding
The most useful notes you can have aren't the lecturer's words. They're yours. After the lecture, talk the topic through as you understand it, in your own words, and let that be your notes. Research on the generation effect and self-explanation points the same way: what you produce and explain yourself is understood and remembered better than what you read.
With TalkGraph you just talk. Your explanation becomes a map of your own understanding, typed into ideas, facts and questions, and you can look back at the lecture's map to see what you covered and what you missed.
Turn it into questions
The same day, write a question for each main idea. "What's the difference between ATP and ADP?" is far more useful at revision time than a paragraph explaining it. In TalkGraph, open questions from the lecture are already collected as question cards, a ready-made list of what to check.
Explain it out loud, and get asked back
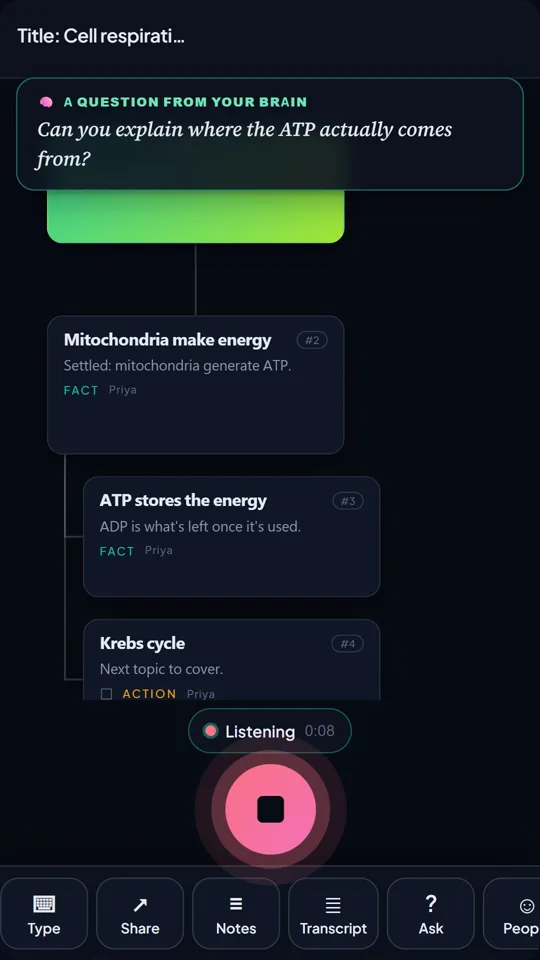
Cover the notes and explain the lecture out loud for three minutes, as if to a friend who missed it. Where you stall is exactly what you don't understand yet. In TalkGraph, when you pause, it asks you a short question about what you just said, the kind an examiner or a good study partner would ask. Answer it out loud and the map grows; the parts you can't answer are your revision list.
Test yourself, then space it out
Testing yourself beats rereading. In a well-known experiment by Henry Roediger and Jeffrey Karpicke, students who practised recalling a passage remembered about 61% of it a week later, against about 40% for students who reread it. A major 2013 review of study techniques, led by John Dunlosky, rated practice testing and spreading study out over time as the two most useful techniques it examined.
In TalkGraph, collapse a map's branches and recall what's under each one before you open it. Every lecture and revision session also feeds your Brain, where a 60-second workout asks you to say five of your ideas back from memory, and ideas you haven't revisited in a month fade until you do. It's spaced practice that comes to you.
Prefer pen and paper in lectures? Respect. Here's a one-page Cornell-style sheet with a cue column, space for notes in your own words, a three-sentence summary and an explain-it-back schedule.
Questions people ask
What's the best way to take lecture notes?
Capture the lecture's structure rather than every sentence, mark what you didn't follow, then turn it into questions and explain it back out loud. TalkGraph can capture the structure for you as the lecturer speaks, so you can listen.
Is it better to take notes by hand or on a laptop?
The research is mixed, and the screen isn't really the issue. What matters is whether you copy words or work with ideas. Seeing the structure of a topic and explaining it in your own words beats verbatim copying however you do it, which is what a TalkGraph map is built for.
What is the Cornell note-taking method?
A page split into a narrow cue column, a wider notes column and a summary at the bottom. You take notes during the lecture, add questions to the cue column afterwards, and use them to test yourself.
Can I record a lecture and turn it into notes?
Yes, if your institution allows it. TalkGraph maps a lecture live from your microphone or browser tab, or from an imported recording or transcript, into a concept map you can revise from, with the transcript kept.
How soon should I review lecture notes?
The same day if you can: turn them into questions and explain the main ideas out loud. Then test yourself again a few days later and about a week later.
TalkGraph maps what you say as you speak and asks you the next question. Free to try, no sign-up.

Klevis is the founder of TalkGraph, which he built and shipped solo. He has a First Class MSc in Computing and Information Systems, and writes about thinking, learning and tools that help people think rather than think for them.
LinkedIn →Sources
- Mueller, P. A. & Oppenheimer, D. M. (2014). The Pen Is Mightier Than the Keyboard. Psychological Science, 25, 1159-1168. doi.org/10.1177/0956797614524581
- Morehead, K., Dunlosky, J. & Rawson, K. A. (2019). How Much Mightier Is the Pen than the Keyboard for Note-Taking? Educational Psychology Review, 31, 753-780. doi.org/10.1007/s10648-019-09468-2
- Roediger, H. L. & Karpicke, J. D. (2006). Test-enhanced learning. Psychological Science, 17(3), 249-255. doi.org/10.1111/j.1467-9280.2006.01693.x
- Dunlosky, J. et al. (2013). Improving students' learning with effective learning techniques. Psychological Science in the Public Interest, 14(1), 4-58. doi.org/10.1177/1529100612453266
- Nesbit, J. C. & Adesope, O. O. (2006). Learning with concept and knowledge maps: A meta-analysis. Review of Educational Research, 76(3), 413-448. doi.org/10.3102/00346543076003413
- Chi, M. T. H. et al. (1994). Eliciting self-explanations improves understanding. Cognitive Science, 18(3), 439-477. doi.org/10.1207/s15516709cog1803_3