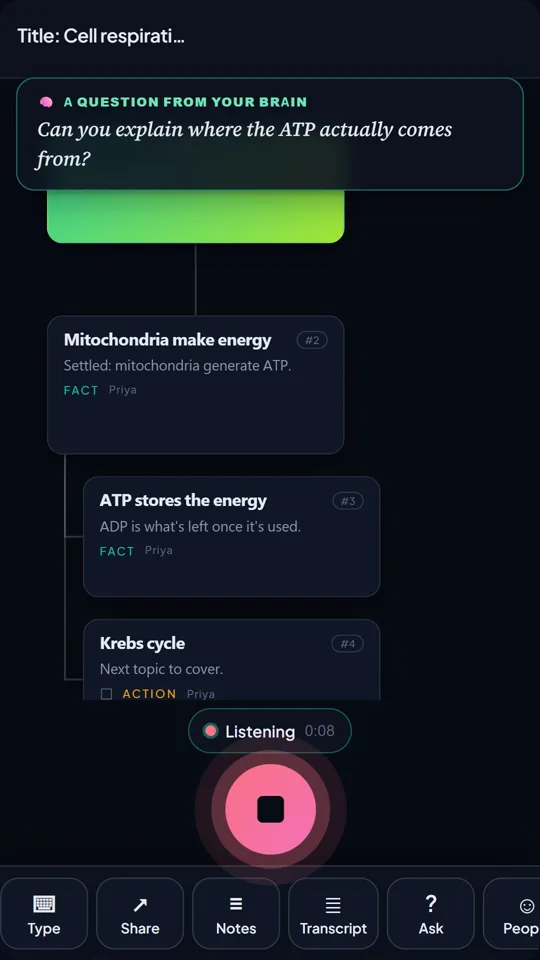
The science of saying it out loud.

TalkGraph stands on decades of research into how people learn, remember and build knowledge: from Ausubel's meaningful learning to modern knowledge graphs. Here's the evidence, and how each finding is built into the product.

The four principles

1 · AI should strengthen thinking, not replace it. TalkGraph structures and expands your ideas. It never writes them for you.

2 · Knowledge compounds like retained customers. Each mapped conversation joins a growing network instead of becoming another forgotten note.

3 · Visual structure improves judgment. Organising concepts into connected graphs produces deeper reasoning than passive summarisation.

4 · Long-term knowledge assets beat disposable outputs. An interconnected graph of what you know is a durable advantage over any one-off AI summary.

1. Knowledge builds on what you already know

David Ausubel's foundational insight in educational psychology is that new learning only sticks when it connects to existing knowledge. His student Joseph Novak turned that into concept mapping, the practice of making relationships between ideas explicit and visible. Lists of facts fade; connected knowledge compounds.

The most important single factor influencing learning is what the learner already knows.

Ausubel, Educational Psychology: A Cognitive View. Archive.org ↗
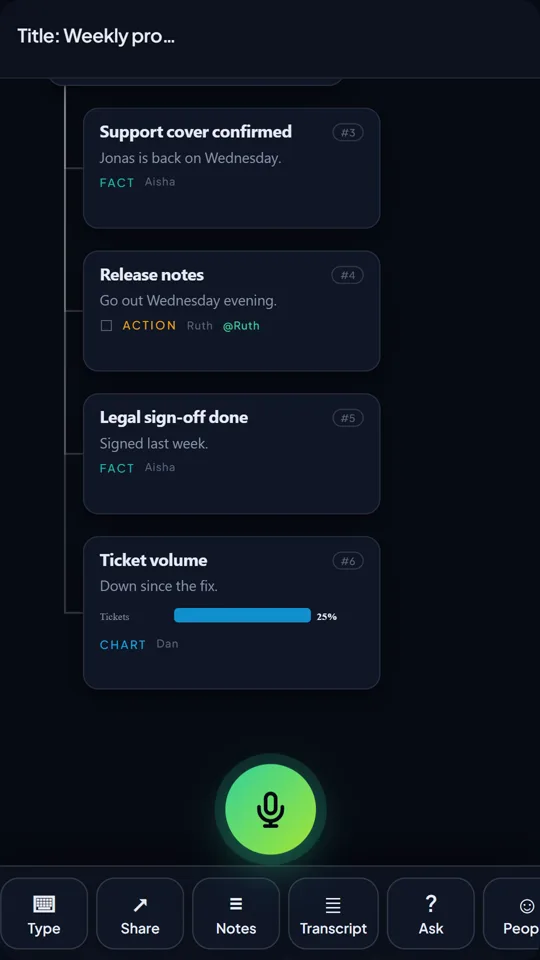
How TalkGraph applies it: every conversation becomes a graph of linked concepts, not a list. New points attach to existing branches, so each meeting literally builds on the last one's knowledge.

2. The strongest evidence: maps improve learning outcomes

A landmark meta-analysis by Nesbit & Adesope pooled 55 studies covering 5,818 learners and found that learning with concept maps produces significant gains in retention and transfer of knowledge. An earlier randomised trial at Barts Medical School found mind-mapped material was retained about 10 to 15% better after one week than self-selected study techniques.

Mind maps provide an effective study technique when applied to written material.

Farrand, Hussain & Hennessy, Medical Education (2002). PubMed ↗ · Meta-analysis: Nesbit & Adesope (2006) ↗
How TalkGraph applies it: concept mapping has strong evidence for learning and retention; TalkGraph removes the drawing friction by generating the structure as you speak. The research proves the ingredients. TalkGraph is a new way of combining them.

3. Working memory holds about four things

Cognitive load research (Sweller, 1988; Cowan, 2001) shows working memory holds roughly four chunks at once. A forty-minute meeting contains hundreds. Good visual organisation isn't decoration. It offloads mental effort, freeing cognition for actual thinking instead of remembering.

How TalkGraph applies it: the graph is external working memory. Every card parked on the map is one your brain doesn't have to hold, and it stays there between meetings.

4. Two channels beat one

Allan Paivio's dual-coding theory shows information encoded both verbally and visually is remembered far better than either channel alone. A transcript is one channel; a map (the same words plus spatial structure, colour and relationships) is two.

Paivio, Mental Representations (1986). Oxford University Press ↗
How TalkGraph applies it: the transcript stays (verbal channel), and everything in it also lives as positioned, typed, coloured cards (visual channel). Same content, two encodings.

5. Verbatim capture is a learning trap

Research from Princeton and UCLA found that verbatim transcription produces shallower processing: words stored, not understood. Learning happens when material is processed and reframed, not transcribed.

Laptop note takers' tendency to transcribe lectures verbatim rather than processing information and reframing it in their own words is detrimental to learning.

Mueller & Oppenheimer, Psychological Science (2014). PubMed ↗
How TalkGraph applies it: the map is the reframe. Speech is distilled into decisions, actions, questions and risks live. The processing happens in the structure itself.

6. Recall beats rereading

Roediger & Karpicke's Test-Enhanced Learning (2006) showed that actively retrieving information strengthens retention far more than passively reviewing it, the principle behind Make It Stick, the classic summary of decades of learning science.

Roediger & Karpicke, Science (2006). Science ↗ · Make It Stick ↗
How TalkGraph applies it: click any card to expand it and test yourself against the map. The graph doubles as a retrieval-practice tool, not just a record.

7. Structured knowledge is where AI is going

Modern AI research converges on the same conclusion as the learning sciences: knowledge is more useful as a graph than as text. Surveys like Hogan et al.'s Knowledge Graphs (2020) document how structured, linked representations power reasoning in everything from Google's Knowledge Graph to enterprise AI.

Hogan et al., Knowledge Graphs (2020). arXiv ↗ · IHMC CmapTools research ↗
How TalkGraph applies it: every graph is machine-readable knowledge from day one, structured enough for AI to answer questions about, expand, and build on.

8. Saying it out loud is itself an encoding advantage

MacLeod and colleagues named it the production effect: words spoken aloud are remembered substantially better than words read silently, because the act of producing them (voice, articulation, hearing yourself) creates extra, distinctive memory traces. The effect has replicated across dozens of studies since 2010.

Production improves memory: saying a word aloud makes it more memorable than reading it silently.

MacLeod, Gopie, Hourihan, Neary & Ozubko, Journal of Experimental Psychology: Learning, Memory, and Cognition (2010). PubMed ↗
How TalkGraph applies it: the input is speech. Every idea you map was produced out loud first. The encoding advantage is built into how the product is used, not bolted on.

9. People grow when they're seen

Gallup's workplace research links regular, meaningful recognition to higher engagement and lower turnover, and Amy Edmondson's work on psychological safety shows teams perform best when every voice is visibly heard. In most meetings, contributions and praise simply vanish into the air.

How TalkGraph applies it: every voice is attributed, praise is a first-class card credited to its recipient, and the People panel keeps a live tally of who contributed what.

The gap TalkGraph fills

Most concept-mapping research assumes the learner manually draws the map. The AI literature, meanwhile, focuses on structured knowledge representation for machines, not human learning. Almost no work sits at the intersection:

live speech → semantic understanding → editable knowledge graph → long-term organisational memory

That intersection is TalkGraph. It captures conversation as it happens, infers the concepts and relationships automatically, and produces a visual knowledge graph that people refine, query and build on, one conversation compounding into the next.

Sources & further reading

  1. Novak, J. D. (1990). Concept mapping: a useful tool for science education. Journal of Research in Science Teaching, 27(10). View ↗
  2. Nesbit, J. C. & Adesope, O. O. (2006). Learning with concept and knowledge maps: a meta-analysis. Review of Educational Research, 76(3). View ↗
  3. Novak, J. D. (1998). Learning, Creating, and Using Knowledge: concept maps as facilitative tools. Routledge. View ↗
  4. Novak, J. D. & Gowin, D. B. Learning How to Learn. Cambridge University Press / Springer. View ↗
  5. Ausubel, D. P. Educational Psychology: A Cognitive View. View ↗
  6. Paivio, A. (1986). Mental Representations: a dual coding approach. Oxford University Press. View ↗
  7. Sweller, J. (1988). Cognitive load during problem solving. Cognitive Science, 12(2). View ↗
  8. Roediger, H. L. & Karpicke, J. D. (2006). Test-enhanced learning. Psychological Science / Science. View ↗
  9. Brown, P., Roediger, H. & McDaniel, M. (2014). Make It Stick. Harvard University Press. View ↗
  10. Hogan, A. et al. (2020). Knowledge Graphs. arXiv:2003.02320. View ↗
  11. Ji, S. et al. A Survey on Knowledge Graphs: representation, acquisition and applications. View ↗
  12. Sawyer, R. K. (ed.). The Cambridge Handbook of the Learning Sciences. View ↗
  13. Hattie, J. Visible Learning. Routledge. View ↗
  14. National Academies (2000). How People Learn: brain, mind, experience, and school. Free to read. View ↗
  15. The Learning Scientists: evidence-based learning resources. View ↗
  16. IHMC CmapTools: concept mapping research, papers and tools from Novak's group. View ↗
  17. Mueller, P. A. & Oppenheimer, D. M. (2014). The pen is mightier than the keyboard. Psychological Science, 25(6). View ↗
  18. Farrand, P., Hussain, F. & Hennessy, E. (2002). The efficacy of the 'mind map' study technique. Medical Education, 36(5). View ↗
  19. Cowan, N. (2001). The magical number 4 in short-term memory. Behavioral and Brain Sciences, 24(1). View ↗
  20. MacLeod, C. M., Gopie, N., Hourihan, K. L., Neary, K. R. & Ozubko, J. D. (2010). The production effect: delineation of a phenomenon. Journal of Experimental Psychology: Learning, Memory, and Cognition, 36(3). View ↗
  21. Gallup: Employee Recognition. View ↗
  22. Edmondson, A. Psychological Safety (Harvard Business School). View ↗
Try it on your next conversation